
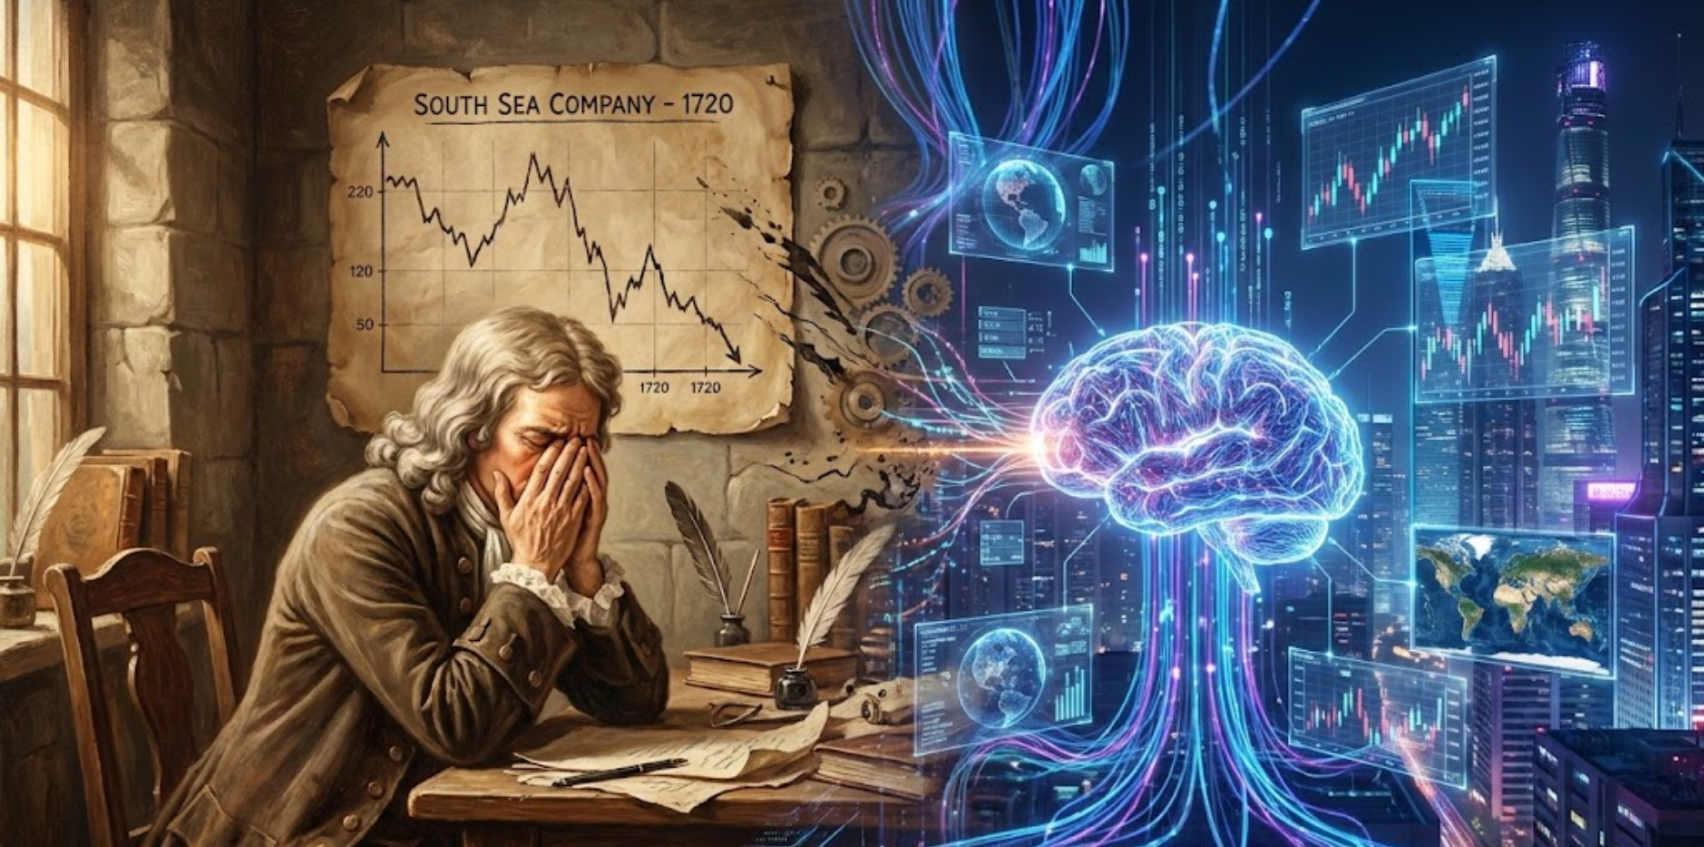
The Problem Newton couldn’t solve
In 1720, during the “South Sea Bubble,” Sir Isaac Newton bought shares early and made a profit of £7,000. That was a huge sum at the time. However, he saw his friends getting even richer as the stock kept climbing. Despite his genius, he succumbed to FOMO (Fear Of Missing Out) and bought back in at the very top.
The Result:
The bubble burst, and the stock crashed. Newton lost £20,000 (equivalent to roughly £4–5 million today). He famously wrote:
“I can calculate the motion of heavenly bodies, but not the madness of people.”
In fact, he was so traumatized by the failure of his prediction that he forbade anyone from speaking the words “South Sea” in his presence. (The incident is well documented here: https://lavoiedubitcoin.info/public/une_histoire/Newton.pdf).
Newton is the father of Calculus. This is the very mathematics used today to model change and predict markets. If anyone should have been able to predict the stock market, it was him.
Why then was Newton unable to solve this? He was capable of immense contributions to Physics, Mathematics, Optics, Alchemy, Economics, and Theology. Yet, he failed at something that seemed right up his alley. More importantly, why does predicting the stock market feel so daunting even to experts in Mathematics and Machine Learning?
Is it even possible? If so, what are the obstacles faced by those who attempt to do so?
The Timeline of Stock Prediction
The very first experiments with predicting the stock market actually began in the late 17th century. They were pioneered by Munehisa Homma (Japan) and Charles Dow (USA).
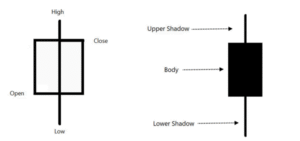
Their goal was to hedge against bad rice harvests or identify broad economic tides. Homma spent years collecting historical data on rice prices to identify patterns. Consequently, he developed what we now know as Candlestick Charts to visualize price movements over time.
Later, Charles H. Dow became renowned for proposing The Dow Theory. This emphasizes the importance of trends and averages. It consists of six main components, one of which is the controversial “Efficient Market Hypothesis” (which we will discuss later).
1900s to 1950s: The Random Walk
From the 1900s to the 1950s, people like Louis Bachelier and Alfred Cowles tried to treat finance as a hard science rather than gambling.
Louis is credited as the first person to model the Stochastic Process, now called Brownian motion. He realized that stock prices move like a drunk person walking home. Just because they took a step left, it doesn’t mean the next step will be right. It is totally random.
In the 1930s, everyone believed that professional financial analysts were geniuses who knew exactly what stocks to buy. Alfred Cowles decided to fact-check this. He gathered 7,500 predictions made by top financial experts over 4 years.
The findings were shocking.
He found that the “experts” were wrong more often than they were right. He proved that a random person (or a monkey) could pick stocks just as well as the professionals. The math suggested the best prediction for tomorrow’s price is simply today’s price. Furthermore, calculating a single correlation coefficient at that time could take hours of hand-writing.
Stochastic Distribution of Probabilities
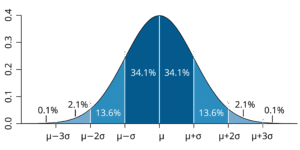
Understanding the “Bell Curve”
This chart is a probability map. It shows that most events (like daily stock changes) usually fall in the tall middle, close to the average. The percentages tell you that 68% of the time things are “normal.” Meanwhile, the flat edges represent extreme events that rarely happen.
Investors use this to measure risk. They assume that while small ups and downs are common, huge crashes are mathematically unlikely.
1930s to 1970s: Minimizing Risk
The mid-20th century was dominated by people trying to minimize risk. They wanted to find companies worth more than their stock price.
Figures like Benjamin Graham (Warren Buffett’s mentor) and Harry Markowitz conducted deep analyses of balance sheets, P/E ratios, and book value. The tradition was to use math (Variance-Covariance matrices) to build a “diversified” basket of stocks. This maximized returns for a specific risk level.
However, one had to wait for companies to mail physical quarterly reports. Additionally, some factors were less measurable. A company could look “cheap” mathematically but be on the verge of bankruptcy due to unquantifiable factors, like a bad CEO.
The Era of Computers and Derivatives
The introduction of computers allowed mathematicians to hunt for small mispricings. Notably, pioneers like Ed Thorp, Fischer Black, Myron Scholes, and Jim Simons tried to arbitrage profit from mathematical errors in the pricing of derivatives (options/futures).
They used differential equations to determine the “correct” price of an option. Additionally, computers scanned thousands of stocks to find pairs that usually moved together but had temporarily drifted apart. Time-Series Forecasting models like ARIMA, borrowed from signal processing, were developed during this era.
The Major Challenges in AI Prediction
1. The Efficient Market Hypothesis
This is the #1 challenge because it suggests the task itself might be futile. It argues that if information is available to everyone, the market has likely already reacted to it. Thus, any profit you make is pure chance.
At first glance, this seems straightforward. However, the implication is harsh. It means no amount of effort allows you to consistently predict the market because it reacts instantly to new public information.
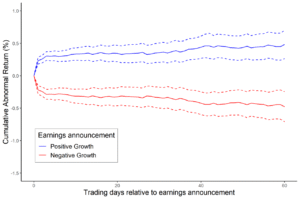
Stock prices quickly incorporate information from earnings announcements, making it difficult to beat the market by trading on these events. A replication of Martineau (2022).
2. Non-Stationarity
This is the primary mathematical reason AI models fail. In physics, the laws of gravity don’t change. In finance, the “laws” change constantly.
A strategy that worked in 2020 (when interest rates were 0%) will likely lose money in 2024 (when rates are 5%). In essence, a model trained on historical data will simply stop being relevant after a while. The statistical properties (mean, variance, median) of the data shift over time, making the past a poor predictor of the future.
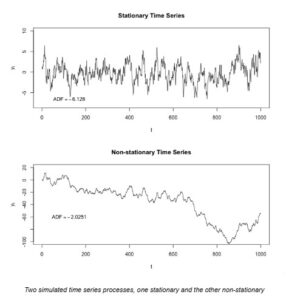
Two simulated time series processes, one stationary and the other non-stationary
3. The Signal-to-Noise Ratio
Financial data is overwhelmingly “noise”. For example, a stock might move up 2% today not because of news, but because a single large mutual fund rebalanced its portfolio.
Normally, every dataset has some noise. But the signal-to-noise ratio in financial data is absurdly low. Marcos López de Prado (Professor at Cornell) argues that it is nearly zero in his research papers. (https://papers.ssrn.com/sol3/papers.cfm?abstract_id=3221798)
In fact, the average daily return of the S&P 500 (signal) is roughly 0.03% to 0.05%. Meanwhile, the daily volatility (noise) is roughly 1%. If we calculate the ratio, the signal is only 1/20th of the noise level. This concept is extensively explained in this academic paper.
https://onlinelibrary.wiley.com/doi/full/10.1111/j.1540-6261.1986.tb04513.x4
4. Adversarial Adaptation (The “Fight Back”)
The stock market is a game against other intelligent players. Everyone thinks they can beat the market. It is potentially the most lucrative use case in history.
This desire for endless money has attracted people willing to invest billions of dollars. If you find a predictable pattern (e.g., “Stocks drop on Mondays”), other traders will spot it and sell on Sunday night.
It gets worse. Advanced algorithms don’t just copy you; they hunt you. This is called “Order Flow Toxicity.” If a large institution’s AI detects that a smaller AI is consistently buying a stock at 10:00 AM, the larger AI will adapt. It will drive the price up just before 10:00 AM, forcing the smaller AI to buy high, and then sell immediately after.
5. Black Swan Events
The biggest moves in history come from events that have no historical precedent in your dataset. An AI trained on 2010–2019 data would have no concept of a global pandemic lockdown. When COVID hit in 2020, models crashed because they encountered a scenario that didn’t exist in their “memory.”
Other Common AI Biases
Survivorship Bias: Training only on companies that exist today (ignoring the ones that went bankrupt). This makes the market look safer than it is.
Look-Ahead Bias: Accidentally giving your model data it shouldn’t have (e.g., using “Today’s Closing Price” to predict “Today’s Trading Decision”).
Overfitting: Creating a model that memorizes the 2022 chart perfectly but fails to predict a single day in 2023.
Is it Even Possible?
After going through all these insurmountable problems, we must ask: Is it even possible to predict the stock market?
The good news is that you don’t need to predict with 100% accuracy to make billions. You only have to be right 51% of the time (better than random chance). Thousands of trades made with this 51% accuracy will eventually compound into massive wealth.
Out of all the pioneers who attempted this, one stands out clearly.
The Success of Jim Simons (1938–2024)
Jim Simons is widely considered the greatest investor in history. However, he was not a “finance guy.” He was a mathematician and Cold War codebreaker.
A prodigy who received his PhD in Mathematics from Berkeley at age 23, Jim became the Chairman of the Math Department at Stony Brook University. He also co-created the Chern-Simons form, a piece of 3D geometry so profound that it is now a foundation of String Theory.
But perhaps the most well-known contribution of his life was realizing that stock prices are just “noisy” time-series data. They are identical to a garbled voice recording.
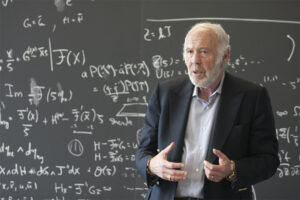
Jim Simons teaching at Stony Brook University
How He Cracked the Code
He “cracked” the market by treating it not as an economic system, but as a chaotic dataset filled with hidden messages. This was exactly like the enemy codes he used to break for the government.
He didn’t hire Wall Street Analysts. Instead, he hired speech recognition experts from IBM and astronomers.
The “Old Method” was to try to define every rule of grammar to understand a word. Simons’ method didn’t try to “understand” the word. He just calculated the probability. “If sound ‘S’ is followed by sound ‘T’, there is an 80% chance the next sound is ‘R’.” Remarkably, this technique is now the primary method used in LLMs.
He looked for “patterns” instead of the “reason.” For example, if Stock A moves up 2 cents, and Gold moves down 1 cent, there is a 50.75% chance Stock B will move up 1 cent. Simons didn’t care about the why. He just knew the pattern existed.
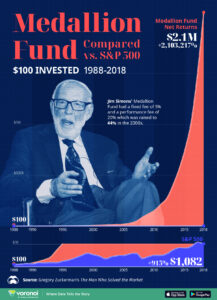
The Medallion Fund Result
Simons built the Medallion Fund, a “black box” algorithm that automated this philosophy. Long before “Big Data” was a buzzword, he sent researchers to the Library of Congress to record terabytes of historical prices (like corn prices from the 1800s) to train the computers.
As his colleague Robert Mercer famously said:
“We’re right 50.75% of the time… but we’re 100% right 50.75% of the time.”
By betting millions of times with a slight edge, the “Law of Large Numbers” guaranteed they would make billions. Jim Simons “solved” the market so effectively that he eventually kicked all outside investors out of the fund. It became a private money printer for him and his employees.
His fund yielded a staggering ~66% (before fees) from 1988 to 2018. To put that in perspective: $1,000 invested with Warren Buffett in 1990 would be worth huge money today. That same $1,000 in the Medallion Fund would be worth millions more. He amassed over $30 billion, largely donated to science and autism research before his death in 2024.
Where Are We Now? (2025 and Beyond)
In late 2025, we are in the “Generative AI & Alternative Data” Era. The focus has shifted from “solving the math” (Jim Simons’ era) to “solving the context.”
The #1 trend is using Generative AI & LLMs to “read” the world. An AI can read 5,000 earnings call transcripts, Federal Reserve speeches, and news articles in seconds. It detects subtle shifts in a CEO’s tone (e.g., hesitation when answering a question about revenue) that a human analyst might miss. It bridges the gap between “Quantitative” (math) and “Fundamental” (business) investing. This strategy is now called “Quantamental.”
Alternative Data:
Standard financial data (P/E ratios, balance sheets) is now considered “commoditized.” Everyone has it, so it offers no advantage. The real money is spent gathering unconventional data like:
- Satellite Imagery.
- Geolocation tracking.
- Credit Card transaction data.
High-Frequency Trading (HFT):
HFT has been around for decades, but it has recently received a massive “brain” upgrade. Fast trading used to rely on simple rules (“If price drops X, buy Y”). Now, they use FPGA chips embedded with AI that can adapt strategies in nanoseconds.
Reinforcement Learning:
Furthermore, the most advanced quantitative funds (like Citadel or D.E. Shaw) use Deep Reinforcement Learning Agents. These agents learn to trade by playing a simulation game against themselves, similar to how AlphaGo mastered Chess.
It’s not over yet
All in all, hope stays alive. Thousands of “Data Scientists”, “Quantitative traders”, and “AI Engineers” wake up everyday to find the signal in the noise. They are armed with tools Newton could only dream of, trying to re-create what Jim Simons did.
The journey of stock prediction—from Japanese rice merchants sketching candles to supercomputers reading satellite imagery—is essentially the “Moon Landing” of Data Science.
While the market remains the ultimate puzzle, the pursuit of solving it has accidentally driven massive leaps in mathematics, physics, and artificial intelligence. We invented Calculus, Probability Theory, and arguably Modern AI partly because we wanted to know what tomorrow brings.
The beauty of the market is that it is alive. It isn’t just a chart of numbers; it is a real-time reflection of human hope, fear, and innovation. While no model will ever capture 100% of the future, the attempt to do so forces us to continuously refine how we understand the world.
As Jim Simons proved: You don’t need to be perfect to be successful. You just need to be curious enough to find the signal in the noise.
Know more about relevant topics:
AlphaFold and the Solution to Levinthal’s Paradox
https://codesmiths.in/alphafold-levinthals-paradox/
Vibe Check: CodeSmiths’ Guide to the Future of Software Development
https://codesmiths.in/vibe-coding-ai-software-development/